martes, 29 de marzo de 2011
A new GPS velocity field from central to northern Peru
Fast subduction of the oceanic Nazca plate beneath the South American continent induces large earthquakes with a carateristic repeat time of 100-150 years in Chile and southern Peru (Compte and Pardo, 1991; Dorbath, et al., 1990; Nishenko, 1991). Previous studies of the interseismic deformation along the Andean subduction using GPS and/or InSAR have shown a current significant level of locking of the interplate interface all along the margin. However, the overall picture is still missing information from thenlatitude 10S (North of Lima, Peru) to 2S (North of Guayaquil, Ecuador). In that area, no large earthquake has been for the last three centuries (Dorbath, et al., 1990; Kelleher, 1972), suggesting on one hand that this portion may be freely aseismically slipping. On the other hand, the factors usually assumed to control the level of locking (convergence rate, age of the ocean floor, presence of sediments along the trench, Ruff and Tichelaar, 1996) are not very different from the adjacent segments where large earthquakes have occurred in the past. The question posed is: has the plate interface accumulated large stress during the last centuries possibly triggering a giant earthquake in the next years or is it aseismically slipping?. We present new GPS results for central to northern Peru resulting from a combination of survey-mode GPS and continuos GPS measurements to answer this question. Our solutions spans the 2007-2010 period (4 years), and includes CGPS sites from the LISN project (http://jro.igp.gob.pe/lisn/) dedicated to monitor the ionosphere, from the ADN project and IGS global stations. We first asses the quality of our time series and discuss the uncertainty of velocities estimates after 2-3 years of data. We first note that the repeatabilities obtained strongly depend of the type of monumentation and equipment used for the vertical component for sites from the LISN network. Nonetheless, for velocity estimates, the agreement with sites showing best repeatabilities are usually within 1-3 mm/yr. Finally, we preliminary conclude that low coupling is found from central Peru at about 8S to the border with Ecuador. Very high coupling is found further south around LIma. We will present preliminary models of coupling based on these results. To be presented in the EGU 2011 Vienna (Villegas JC, et., al 2011)
viernes, 18 de marzo de 2011
lunes, 14 de marzo de 2011
Preliminary results for the Japan - Sendai Earthquake March 11th 2011 - Seismology and Geodesy
PRELIMINARY RESULTS BASED ON SEISMOLOGICAL AND GEODETIC OBSERVATIONS PUBLISHED BY RESEARCHERS FROM UNIVERSITIES AND LABORATORIES AROUND THE WORLD.
At 14:46 (Local Time) 03/11/2011, an earthquake of 9.0 Mw occurred on the pacific coast from Sanriku to Ibaraki. Below figures show the mechanism by Earthquake Reseach Institute, USGS, Global CMT (left to right). Low-angle reverse fault are achieved in all of them.


The optimal location of the W-phase solution was estimated by grid search method. Probable location ranged in wide area along North-South direction. Parameters of best fit solution are as follows: slope:10,Half duration:70 s,depth 24 km, 38 degrees northern latitude,143 degrees eastern longitude(indicated with red star). Again note that a good waveform-fit was achieved in a wide range at North-South.

Preliminary pre-seismic interplate coupling inversion from 257 pre-seismic GPS measurements of the Japanese Network (period 2001-2011). The GPS measurements are plotted relative to the Amurian Plate. The fault geometry was taken to be consistent with USGS Fault solution and Harvard CMT. Dashed line may indicate the seismic source (Mohamed Chlieh from IRD - Geoazur - France). Asperities in red could be ruptured in cascade.
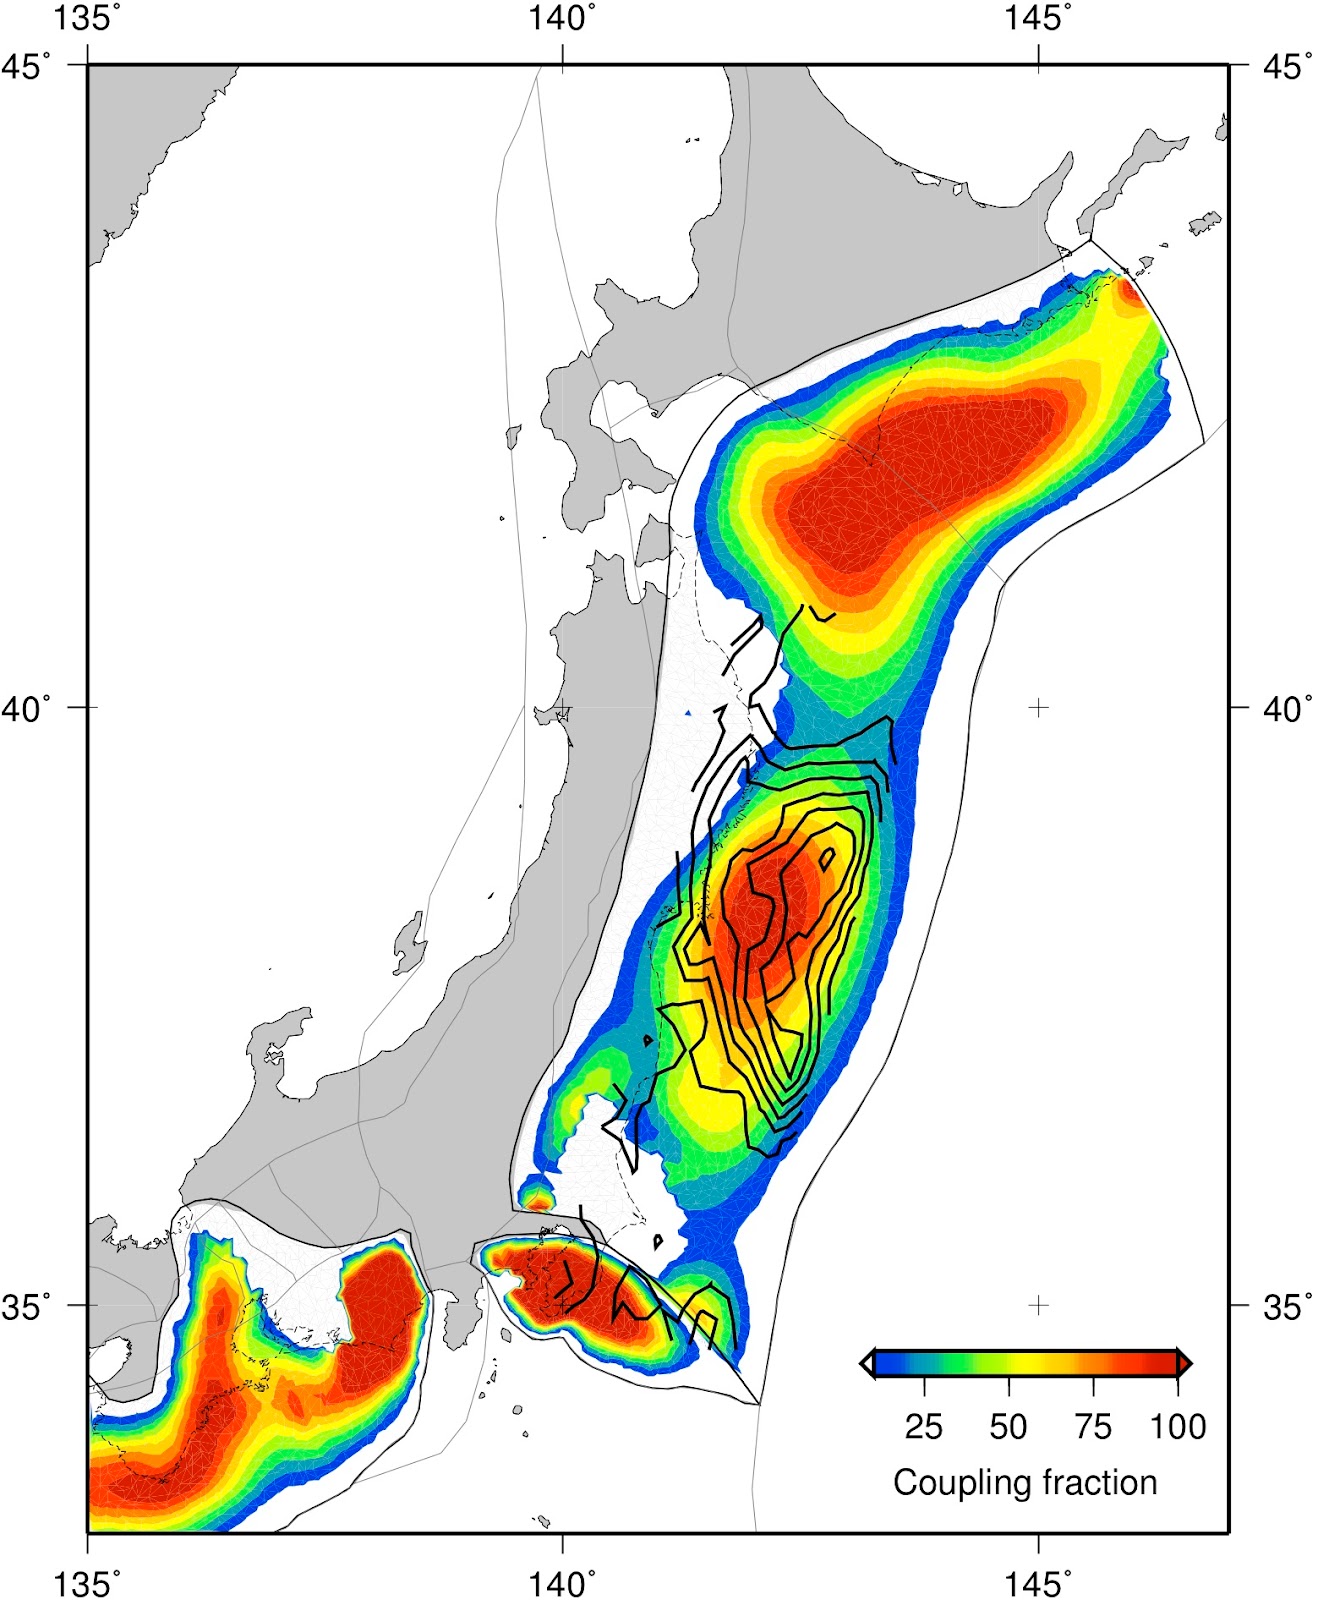
INTERSEISMIC COUPLING distribution based on GEONET GPS data from 1996-2000 and estimated using a three-dimensional block model of the combined offshore/onshore fault network (Loveless and Meade, JGR, 2010) . Coupling was estimated on a mesh of triangular dislocation elements based on 3D slab geometry.


COSEISMIC DISPLACEMENT - HORIZONTAL AND VERTICAL displacements based on estimated position of GEONET stations. Coseismic displacement is shown in red, and first 8 hours of postseismic displacement at available stations is shown in blue. Bars at end of vector show 95% error estimate. Solutions courtesy of ARIA team at JPL and Caltech. Preliminary computation shows a horizontal displacement of ~2.4 mts (USGS, Kenneth).

Slip distribution on a curved plate interface using coseismic GPS vectors from the Geospatial Information Authority of Japan. The above plot shows the slip distribution, which extends about 400km N-S and reaches a maximum of about 10 meters. (Ito, Ozawa, Watanabe and Sagiya from Nagoya University)

High-rate 1-Hz data from one station of the International GNSS Service affected by the Sendai earthquake. The record is from the MIZU station located at Mizusawa. The analysis approach uses PPP or precise point positioning, a technique that requires meticulous modeling of all of the phenomena affecting GPS measurements to reveal station displacements with precisions approaching a few centimetres. (Banville and Langley from University of New Brunswick)
domingo, 13 de marzo de 2011
SENDAI EARTHQUAKE - felt in Tsukuba - Peruvian student
Sheila Y. grabó estas imagenes en los precisos instantes que ocurria el terremoto de Sendai Japon del 11 de Marzo de 2011.
Sheila Y. recorded this video during class just when the Mw 9.0 Earthquake occurred the 11th March 2011 in Sendai region JAPAN. (she was very brave).
jueves, 10 de marzo de 2011
Análisis estadístico de anomalías ionosféricas antes de la ocurrencia de grandes sismos (+M6.0 durante 2002-2010)
Recientemente Le. H., et al (2011) publicaron un articulo en la revista JGR un estudio relacionado a las anomalias ionosféricas observadas antes de la ocurrencia de grades terremotos a nivel mundial. El análisis se basa en la medición del Contenido Total de Electrones (TEC) del mapa mundial de la ionosfera. Para el estudio los autores seleccionaron un total de 736 sismos con magnitudes superiores a M6.0 ocurridos a nivel mundial durante los años 2002 a 2010. En primer lugar se define la anomalía tipica diaria, luego se define la tasa de ocurrencia de días anómalos para los 21 días previos a la ocurrencia del sismo (PE = prior to earthquakes), también se estimaron los días background (PN). Los resultados muestran que los valores de PE dependen de la magnitud del terremoto, la profundidad de la fuente y el número de días previos al terremoto. El PE es mayor para los terremotos de mayor magnitud y menor profundidad y para días cercanos al evento. Los resultados también muestran que la tasa de ocurrencia de las anomalías muchos días antes del sismo es notoriamente mayor que ese valor durante los días background, especialmente para sismos superficiales de gran magnitud.
De los resultados obtenidos por los autores se puede rescatar que las anomalías TEC, observadas algunos días previos a la ocurrencia de un sismo, están relacionadas con una alta probabilidad de la ocurrencia de un sismo. De seguro es necesario profundizar en este tema con mas datos pero desde ya en adelante estos resultados pueden servir para validar estudios de pronostico de terremotos en el futuro.
Un dato adicional, las mediciones para obtener el TEC (Total Electron Content) pueden ser obtenidas por ejemplo utilizando sistemas de posicionamiento global, con antenas y sistemas de registro adecuados.
domingo, 27 de febrero de 2011
Evaluación del Riesgo de Tsunami por sismos regionales en Pisco - Peru (Okal, et al 2006)
El estudio realizado por Okal, et al 2006, trata sobre la evaluación del riesgo de tsunami frente a la costa del departamento de Pisco. Esta investigación formó parte de los estudios para la construcción de una planta de gas natural licuado en esta localidad. Para el estudio los autores consideran el catalogo de sismos histórico e instrumental, seleccionando 6 sismos generadores de tsunamis con daños desde moderados a catastróficos en la ciudad de Pisco (Ver Tabla).


El modelamiento numérico se efectuó mediante el algoritmo MOST (Titov and Synolakis (1997)), utilizando diferentes modelos de fuente de ruptura propuestos por diversos autores. La deformación estática vertical del fondo marino, utilizada como condición inicial para llevar a cabo el modelamiento numerico, fue calculada mediante la metodología propuesta por Okada (1985)


Los resultados del modelamiento numérico para los 6 eventos seleccionados presentan muy buen acuerdo con los valores de run-up y daños reportados por diversos autores (Solov'ev, et al 1984, Dorbath, et al 1990). Las Figuras anteriores ilustran los dos modelos de fuente de ruptura propuestos para el sismo del sur de Perú de 1868 (M ~9). Este sismo es considerado como uno de los mas grandes en términos de magnitud y área de ruptura que se haya producido en esta región. En la Figura de la izquierda, considerando un modelo fuente de ruptura de 600 km, se observa que los valores de run-up en Pisco son del orden de ~3 metros, lo cual no estaría de acuerdo con las observaciones y daños observados en Pisco. Debido a esto, el autor sugiere un segundo modelo de fuente (derecha) de mayor extensión de 900 km, el cual tendría un mejor acuerdo con las observaciones y registro del tsunami. No obstante, la presunción de este segundo modelo implica que la dorsal de Nazca, considerada como una barrera asísmica, no se comportaria como tal, sino que actuaría como un obstáculo que en ciertas ocasiones ha frenado la ruptura de eventos moderados y en otras, para eventos de mayor magnitud, habría sido sobrepasada tal como sugiere el modelo de Okal para el sismo de 1868 y 1687.
 Finalmente, en base al modelamiento numérico y al análisis de la distribución espacio-temporal de las áreas de ruptura en el sur del Peru, el autor sugiere que la recurrencia de eventos sísmicos generadores de tsunamis con valores de run-up menores a diez metros con daños moderados es del orden de ~50 años, mientras que para tsunamis con valores de run-up mayores a diez metros con daños catastróficos es del orden de ~140 años (como los sismos ocurridos en 1868 y 1746).
Como se sabe, un año después de esta publicación ocurrió el sismo de Pisco de 2007, el cual produjo en esta zona valores de run-up del orden de 3 metros y más al sur de la península de Paracas valores de run-up del orden de 10 mts (Woodman, 2007; Yauri, et al 2007; DHN, 2007). Para este sismo la dorsal de Nazca se habría comportado como una barrera sísmica frenando la ruptura del terremoto de Pisco hacia el sur (Sladen, 2010).


El modelamiento numérico se efectuó mediante el algoritmo MOST (Titov and Synolakis (1997)), utilizando diferentes modelos de fuente de ruptura propuestos por diversos autores. La deformación estática vertical del fondo marino, utilizada como condición inicial para llevar a cabo el modelamiento numerico, fue calculada mediante la metodología propuesta por Okada (1985)


Los resultados del modelamiento numérico para los 6 eventos seleccionados presentan muy buen acuerdo con los valores de run-up y daños reportados por diversos autores (Solov'ev, et al 1984, Dorbath, et al 1990). Las Figuras anteriores ilustran los dos modelos de fuente de ruptura propuestos para el sismo del sur de Perú de 1868 (M ~9). Este sismo es considerado como uno de los mas grandes en términos de magnitud y área de ruptura que se haya producido en esta región. En la Figura de la izquierda, considerando un modelo fuente de ruptura de 600 km, se observa que los valores de run-up en Pisco son del orden de ~3 metros, lo cual no estaría de acuerdo con las observaciones y daños observados en Pisco. Debido a esto, el autor sugiere un segundo modelo de fuente (derecha) de mayor extensión de 900 km, el cual tendría un mejor acuerdo con las observaciones y registro del tsunami. No obstante, la presunción de este segundo modelo implica que la dorsal de Nazca, considerada como una barrera asísmica, no se comportaria como tal, sino que actuaría como un obstáculo que en ciertas ocasiones ha frenado la ruptura de eventos moderados y en otras, para eventos de mayor magnitud, habría sido sobrepasada tal como sugiere el modelo de Okal para el sismo de 1868 y 1687.

Como se sabe, un año después de esta publicación ocurrió el sismo de Pisco de 2007, el cual produjo en esta zona valores de run-up del orden de 3 metros y más al sur de la península de Paracas valores de run-up del orden de 10 mts (Woodman, 2007; Yauri, et al 2007; DHN, 2007). Para este sismo la dorsal de Nazca se habría comportado como una barrera sísmica frenando la ruptura del terremoto de Pisco hacia el sur (Sladen, 2010).
jueves, 10 de febrero de 2011
Using TFORM tool from GAMIT/GLOBK
To convert diverse types of coordinates:
Example:
$ tform
Program TFORM 3.11 of 2010/10/27 17:13:00 (Darwi)
Specify initial coordinate characteristics:
1=Cartesian 2=Spherical 3=Geodetic 4=Local 5=Cylindrical: 1
Input Coordinate File
(return for terminal input): nombre del archivo (con sgte. forma:
AREQ_GPS 1942826.2210 -5804070.3577 -1796894.2270 ).
Si no se tiene archivo, ingresar manualmente después de dar return:
Enter X,Y,Z in meters
1942826.2210 -5804070.3577 -1796894.2270
1=Add
2=Subtract
3=Cartesian length
4=Convert coordinate type (e.g. cartesian=>spherical)
5=Transform coordinates to another system (e.g. WGS=>SV6)
6=Estimate transformation
Specify operation:4
Specify output coordinate characteristics:
1=Cartesian 2=Spherical 3=Geodetic 4=Local 5=Cylindrical: 3
1=Decimal 2=L-file (Deg Min Sec): 1
Output Coordinate File (return for terminal input): in WGS84
-16.46551657 288.50720351 2488.9444
It's done...
Suscribirse a:
Entradas (Atom)